
Photo by Nicholas Cappello on Unsplash
Why Money Flow Index is A Powerful Tool for Forex Traders
Forex trading can be complicated. But, using the right tools and indicators can make it easier. One of these tools is the Money Flow Index (MFI), a helpful indicator for analyzing market trends.
The Money Flow Index, also known as the “volume-weighted RSI,” uses price and volume data to help traders understand trend strength.
This makes it an essential tool for those looking to improve their trading strategies and achieve better results.
In this guide, we’ll explain what the Money Flow Index is, how it works, and how you can use it to improve your Forex trading.
What is the Money Flow Index (MFI)?
The Money Flow Index is a technical tool. It measures the flow of money into and out of a currency pair or financial asset over a set time.
The tool uses both price and volume data, making it more detailed than many other indicators.
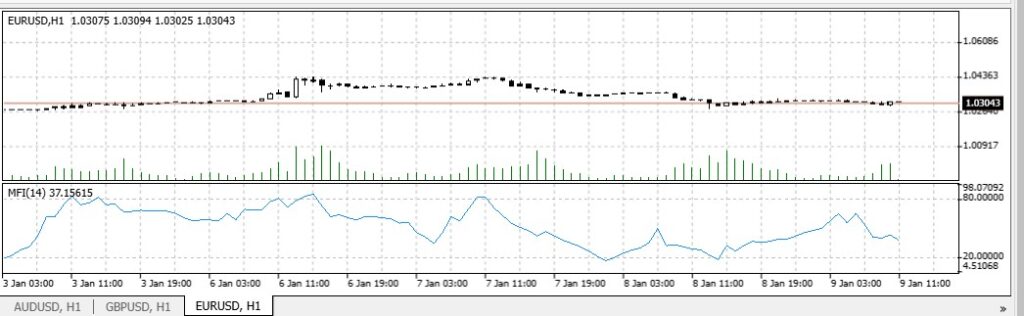
The MFI ranges between 0 and 100, helping traders identify overbought or oversold conditions in the market.
Key Features of the Money Flow Index:
- Uses Volume Data: MFI includes trading volume to show how strong buying or selling pressure is.
- Overbought/Oversold Levels: An MFI above 80 means the market may be overbought. Meanwhile, below 20 suggests it may be oversold.
- Finds Reversals: The MFI can highlight potential market reversals by showing differences between price trends and money flow trends.
For Forex traders, these features make the MFI a great tool to spot trends and refine entry or exit points. Understanding the money flow index indicator is crucial for effectively integrating it into your trading approach.
How is the Money Flow Index Calculated?
Although most trading platforms calculate the MFI for you, understanding how it’s done can help you trust the results. Learning the money flow index calculation process enables traders to gain deeper insights into the indicator’s values.
A Step-By-Step Simple Example
Understanding how the Money Flow Index (MFI) works is easier with a step-by-step example. Let’s break it down:
Example Data:
We’ll calculate the MFI for 3 periods using the following data:
| Period | High | Low | Close | Volume |
|---|---|---|---|---|
| 1 | 110 | 100 | 105 | 1,000 |
| 2 | 115 | 105 | 110 | 1,200 |
| 3 | 112 | 102 | 108 | 800 |
Step-by-Step Calculation:
- Typical Price (TP):
The average of the High, Low, and Close prices:
- Period 1: 105
- Period 2: 110
- Period 3: 107.33
2. Money Flow (MF):\
Multiply the Typical Price by Volume:
- Period 1: 105,000
- Period 2: 132,000
- Period 3: 85,867 (rounded from 85,866.67)
3. Classify Positive and Negative Money Flow:
- Positive Money Flow is calculated when the Typical Price (TP) of the current period is higher than the TP of the previous period.
- In this case, the Money Flow is positive, and its value is added to the Positive Money Flow sum.
- Negative Money Flow is calculated when the TP of the current period is lower than the TP of the previous period.
- In this case, the Money Flow is negative, and its value is added to the Negative Money Flow sum.
Compare each period’s TP with the previous period.
- Period 2: → Positive MF = 132,000
- Period 3: → Negative MF = 85,864
- Calculate the Money Flow Ratio (MFR):
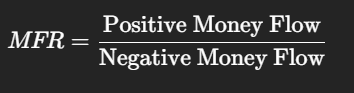
Money Flow Ratio (MFR):
1.537
2. Money Flow Index (MFI):
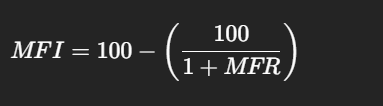
Money Flow Index (MFI):
60.59
Final Result:
The MFI for this example is 60.59, indicating a neutral zone between overbought and oversold levels.
This simplified process shows how MFI uses price and volume data to gauge market momentum.
Most trading platforms DO THE MATH for you. But, knowing the calculation helps you understand and trust the results!
Why is the Money Flow Index Useful in Forex Trading?
The MFI is unique because it combines price and volume data, giving traders a better understanding of market trends. Here are some reasons why it’s helpful:
- Spotting Overbought and Oversold Conditions:
If the MFI is above 80, it’s a signal that the market might be overbought. Below 20, the market might be oversold. - Identifying Divergences:
For example, if prices are making higher highs but the MFI is making lower highs, it could mean the trend is weakening. - Confirming Trends:
A rising MFI supports a strong uptrend, while a falling MFI confirms a strong downtrend. - Pairing with Other Tools:
The MFI works well with other indicators like RSI and moving averages, helping traders create stronger strategies. For example, combining the money flow index forex strategy with candlestick patterns enhances trading decisions.
How to Use the Money Flow Index in Forex Trading
Using the MFI doesn’t have to be difficult. Here are some simple steps to follow:
1. Check Overbought and Oversold Levels
- Overbought: When the MFI goes above 80, it might be time to sell as the market could reverse.
- Oversold: When the MFI falls below 20, it might be time to buy as the market could rebound.
Example:
If you’re trading EUR/USD and the MFI is at 85, and the price is near resistance at 1.1000, it’s a good sell signal. If the MFI drops to 15 near support at 1.0800, it’s a potential buy signal.
2. Look for Divergences
- Bullish Divergence: When prices make lower lows, but the MFI makes higher lows, it signals weaker selling pressure.
- Bearish Divergence: When prices make higher highs, but the MFI makes lower highs, it signals weaker buying pressure.
Tip:
Use candlestick patterns or tools like MACD to confirm divergences for better accuracy.
3. Combine MFI with Trend Analysis
- Use MFI to confirm trends in trending markets.
- Avoid relying on MFI in sideways or choppy markets.
- A money flow index strategy that combines trend analysis and volume-based insights can boost trading accuracy.
Example:
If GBP/USD is trending up and the MFI stays between 50-70, the trend is still strong. Wait for the MFI to reach extreme levels before acting.
4. Set Clear Stop-Loss and Take-Profit Levels
Always use stop-loss and take-profit points with MFI signals. This will help you manage risks better.
Common Mistakes to Avoid
1. Ignoring Market Context:
MFI signals might not work well in low-volume or highly volatile markets. Always consider the bigger picture.
2. Relying Only on the MFI:
No indicator is perfect. Combine the MFI with other tools to get better results.
3. Not Adjusting Settings:
The default 14-period setting might not suit all trading styles. Shorter periods make the MFI more sensitive, while longer periods make it smoother. Test to find what works best for you.
Advanced Tips for Using the Money Flow Index
- Adjust Thresholds:
For volatile pairs like GBP/JPY, use 85 and 15 instead of 80 and 20 to reduce false signals. - Combine with Patterns:
Use MFI with patterns like double tops or head-and-shoulders for more accurate trades. - Use Multiple Timeframes:
Check the MFI on higher timeframes to confirm trends and lower timeframes to find entry points. For example, use the daily chart to spot a trend and the 1-hour chart to time your trades. Knowing how to read money flow index values across timeframes can refine your entries and exits.
Final Thoughts
The Money Flow Index is a powerful tool that helps Forex traders understand market trends and make smarter decisions. It’s especially useful for spotting overbought or oversold conditions, confirming trends, and identifying potential reversals.
By combining price and volume data, the MFI provides unique insights that can improve your trading strategy. Just remember to use it alongside other indicators and always have a risk management plan.
Leveraging a money flow index indicator strategy can elevate your trading outcomes significantly.
Start your journey today with StyleForex.com—your partner in the exciting world of Forex trading. Unlock expert insights, practical tips, and a suite of resources designed for traders at every level.