Technical Analysis

Why Money Flow Index is A Powerful Tool for Forex Traders
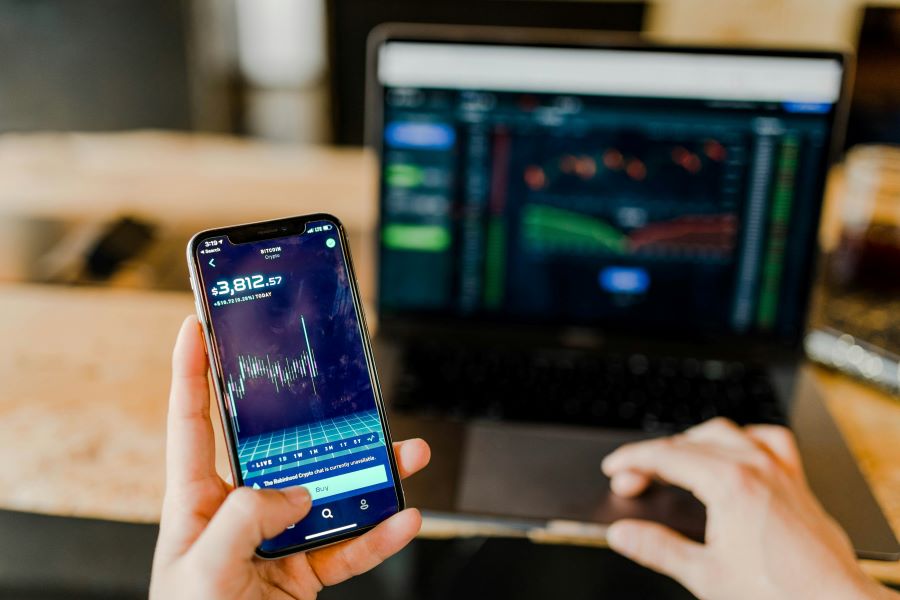
Photo by Nicholas Cappello on Unsplash Why Money Flow Index is A Powerful Tool for Forex Traders Forex trading can be complicated. But, using the right tools and indicators can make it easier. One of these tools is the Money Flow Index (MFI), a helpful indicator for...
Forex Parabolic SAR: How to Uncover Its Trading Potential
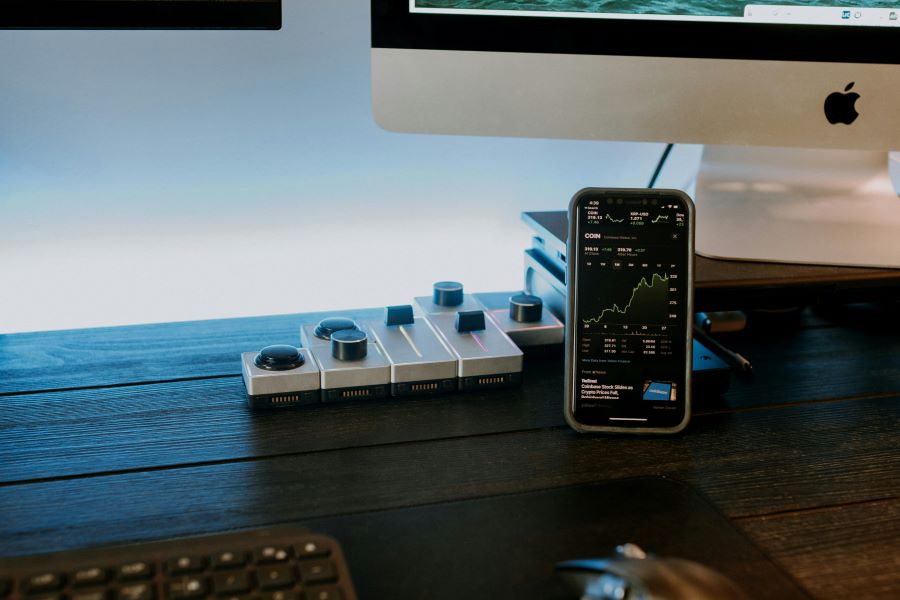
Photo by Austin Distel on Unsplash Forex Parabolic SAR: How to Uncover Its Trading Potential The Forex Parabolic SAR (Stop and Reverse) is a useful tool that can help you make better trading decisions. Known for its effectiveness in identifying trends, this...
How to Master Forex Pivot Points
Photo by Kelly Sikkema on Unsplash How to Master Forex Pivot Points Are you looking to boost your forex trading? Forex pivot points can be the tool you need. This key indicator has been a staple in many traders' toolboxes for its simplicity and effectiveness. In this...
How to Master Ichimoku Cloud in Forex Trading
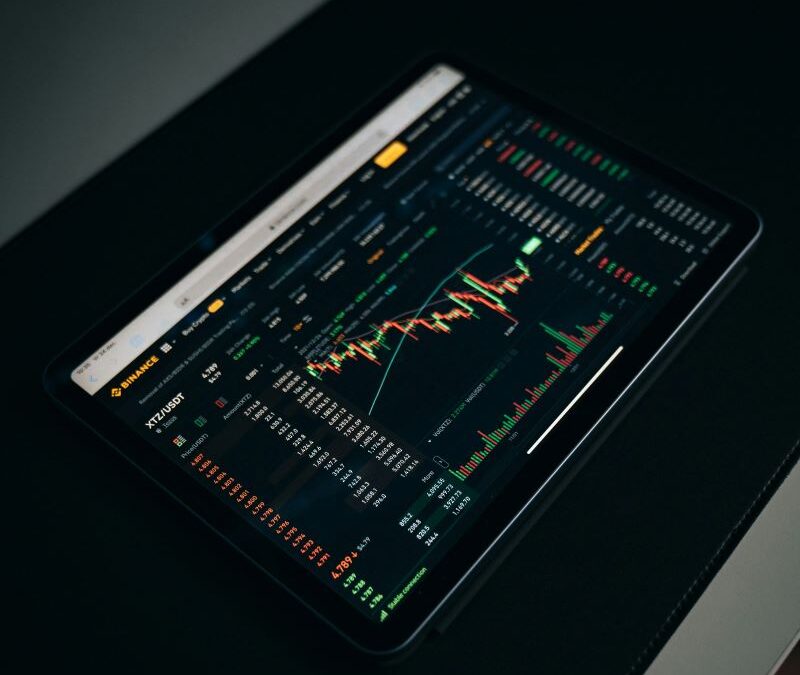
Photo by Dylan Calluy on Unsplash How to Master Ichimoku Cloud in Forex Trading What if a single tool could simplify trading and give you a clear view of trends, support, and resistance as well as market momentum? That’s the Ichimoku Cloud in Forex. By understanding...

Commodity Channel Index: How to Optimize for Forex Trading
Learn to leverage the Commodity Channel Index (CCI) for effective Forex trading strategies. Master the art of identifying overbought or oversold markets.
How to Ride Forex Trends: Average Directional Index
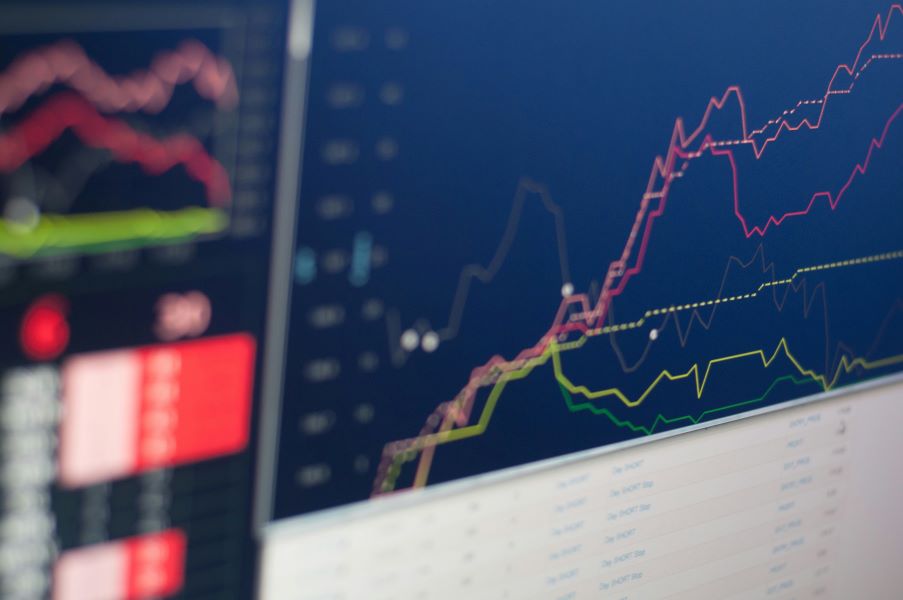
Photo by Chris Liverani on Unsplash How to Ride Forex Trends: Average Directional Index In forex trading, identifying and capitalizing on trends is crucial for success. The Average Directional Index (ADX) is a powerful tool. This tool helps gauge the strength of a...
How to Trade Forex with Bollinger Bands and Volatility
Photo by Nicholas Cappello on Unsplash How to Trade Forex with Bollinger Bands and Volatility Volatility in Forex trading is both a challenge and an opportunity. Navigating these dynamic conditions requires the right tools and strategies. Among the most popular...
Forex Momentum and Volume Indicators for Better Results
Enhance your forex trading strategy by mastering Momentum and Volume to spot market trends and make informed decisions.
How to Perform a Forex Technical Analysis for Beginners
How to Perform a Forex Technical Analysis for Beginners Ever wondered how Forex traders predict market trends with precision and confidence? It's by performing a simple Forex technical analysis. By leveraging basic tools such as candlestick charts, line charts,...

How Forex Oscillators Work : RSI, Stochastic, and MACD
Photo by Jonathan Francisca on Unsplash How Forex Oscillators Work : RSI, Stochastic, and MACD Forex oscillators are tools to improve how you trade by giving clues about where the market might be headed. These tools answer key questions, like "What is oscillator in...
FAQ for StyleForex.com – Technical Analysis Category
1. What is technical analysis in forex trading?
Technical analysis involves studying price charts, patterns, and indicators to predict future market movements. It helps traders identify trends, support and resistance levels, and potential entry or exit points.
2. How does technical analysis differ from fundamental analysis?
While technical analysis focuses on price action and historical data, fundamental analysis examines economic factors like interest rates, GDP, and geopolitical events to determine a currency’s value.
3. Do I need special tools for technical analysis?
Yes, most traders use charting platforms like MetaTrader, TradingView, or other broker-provided tools. These platforms offer indicators, drawing tools, and timeframes to conduct in-depth analysis.
4. What are the most commonly used indicators in technical analysis?
Popular indicators include:
- Moving Averages: To identify trends and smoothing price data.
- Relative Strength Index (RSI): For measuring market momentum.
- MACD (Moving Average Convergence Divergence): To identify trend reversals.
- Bollinger Bands: To determine volatility and price levels.
- Fibonacci Retracements: For spotting potential support and resistance levels.
5. Can technical analysis guarantee trading success?
No, technical analysis provides probabilities, not guarantees. While it helps make informed decisions, trading success also depends on risk management, market knowledge, and emotional discipline.
6. How do I learn technical analysis as a beginner?
Start by:
- Reading guides on basic chart patterns and indicators.
- Practicing on demo accounts to understand how indicators work.
- Following StyleForex.com’s in-depth tutorials and blog posts on technical analysis.
7. What timeframes are best for technical analysis?
It depends on your trading style:
- Scalpers: Use 1-minute or 5-minute charts.
- Day traders: Prefer 15-minute or 1-hour charts.
- Swing traders: Focus on daily or 4-hour charts.
- Position traders: Use weekly or monthly charts.
8. How important are chart patterns in technical analysis?
Chart patterns like Head and Shoulders, Double Tops/Bottoms, and Triangles are critical. They indicate potential trend reversals or continuations, giving traders valuable insights for decision-making.
9. Should I use multiple indicators in my analysis?
While using multiple indicators can provide a comprehensive view, avoid overcrowding your charts. Focus on a few complementary indicators to avoid conflicting signals and analysis paralysis.
10. What are candlestick patterns, and why are they important?
Candlestick patterns, like Doji, Hammer, or Engulfing, provide insights into market sentiment and potential reversals. They help traders understand who’s in control: buyers or sellers.
11. Is technical analysis suitable for all forex traders?
Yes, but its effectiveness varies with trading styles. Day traders and scalpers rely heavily on technical analysis, while position traders often combine it with fundamental analysis.
12. How often should I update my technical analysis?
Regularly! Markets change rapidly, so update your analysis before entering trades and monitor key levels during your open trades to adjust your strategy as needed.
13. Can I automate technical analysis?
Yes, many trading platforms allow you to automate analysis with tools like Expert Advisors (EAs) or scripts that apply your chosen indicators and rules automatically.
14. How do I avoid common mistakes in technical analysis?
- Don’t overcomplicate your charts with too many indicators.
- Avoid trading solely based on one indicator.
- Always combine technical analysis with proper risk management.
- Practice and backtest your strategies on historical data.
15. Where can I learn more about technical analysis on StyleForex.com?
Visit our Technical Analysis category to find:
- Step-by-step guides on popular indicators.
- Tutorials on chart patterns and strategies.
- Updates on market trends and technical setups.
At StyleForex.com, we simplify technical analysis to help you trade confidently. Explore our resources and enhance your trading skills today!