
Photo by Nicholas Cappello on Unsplash
How to Trade Forex with Bollinger Bands and Volatility
Volatility in Forex trading is both a challenge and an opportunity. Navigating these dynamic conditions requires the right tools and strategies. Among the most popular technical indicators is Bollinger Bands.
Bollinger Bands is a powerful method to analyze market volatility and predict potential price movements.
In this comprehensive guide, we’ll delve into Bollinger Bands and effective volatility trading strategies, complete with real-life examples to enhance your understanding.
What Are Forex Bollinger Bands?
Bollinger Bands, introduced by John Bollinger in the 1980s, are a versatile technical indicator designed to measure market volatility and identify overbought or oversold conditions. .
These bands dynamically adjust to market conditions, expanding during high volatility and contracting when the market is calm.
Components of Bollinger Bands:
- Middle Band: A simple moving average (SMA), commonly set to 20 periods.
- Upper Band: The middle band plus two standard deviations.
- Lower Band: The middle band minus two standard deviations.
By plotting these bands on a price chart, traders can better visualize price dynamics and market conditions.
Bollinger Bands and Volatility in Forex
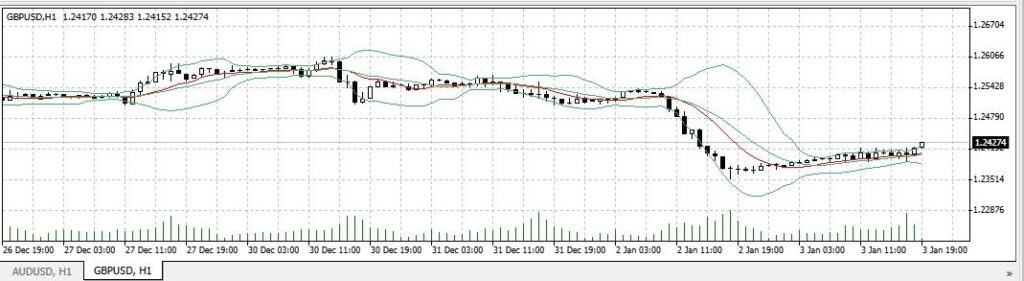
Source: WebTrader VT Markets Demo : Deviation = 2; 14-day period chart on GBP/USD pair
1. Measuring Volatility with Bollinger Bands
Bollinger Bands excel at visualizing market volatility. When the bands widen, it indicates increased volatility, often seen during major news events or economic releases.
Conversely, narrowing bands suggest a period of consolidation or reduced volatility.
2. Interpreting Bollinger Bands Signals
The position of the price relative to the bands provides actionable insights:
- Upper Band: Price touching or exceeding this level may indicate overbought conditions.
- Lower Band: Price reaching this level might signal oversold conditions.
- Middle Band: Price oscillating around the SMA often signifies a ranging market.
Volatility Trading Strategies Using Bollinger Bands
1. Bollinger Bounce Strategy
This strategy leverages the tendency of prices to bounce between the upper and lower bands in ranging markets.
Steps:
- Enter a long position when the price touches the lower band and shows signs of reversal (e.g., a bullish candlestick pattern).
- Enter a short position when the price touches the upper band and reverses downward.
- Place stop-loss orders just outside the opposite band to minimize risk.
Example:
During a calm trading session, EUR/USD repeatedly oscillates between 1.1000 and 1.1200. A trader enters a buy position at 1.1000 (lower band) and sets a take-profit at 1.1200.
2. Bollinger Squeeze Strategy
The Bollinger Squeeze occurs when volatility decreases, causing the bands to narrow. This often precedes a significant price movement.
Steps:
- Identify periods of low volatility by observing narrowed bands.
- Anticipate a breakout in either direction.
- Enter a trade in the direction of the breakout and place a stop-loss just outside the range.
Example: GBP/USD’s Bollinger Bands narrow significantly during a quiet market. A breakout occurs above 1.3000, signaling a bullish trend. The trader enters a buy position and rides the trend upward.
3. Breakout Trading Strategy
Breakouts occur when the price moves beyond the upper or lower band, signaling potential trend continuation. .
Steps:
- Wait for the price to close beyond one of the bands.
- Enter a trade in the direction of the breakout.
- Set a stop-loss at the opposite band to mitigate risk.
Example: USD/JPY breaches its upper band at 140.50 after an economic announcement, indicating a bullish continuation. A trader enters a buy position and profits from the upward momentum.
Practical Bollinger Bands Examples and Calculations
To better understand Bollinger Bands, let’s calculate them using a hypothetical scenario:
5-Day Closing Prices for EUR/USD: 1.2000, 1.2050, 1.2100, 1.2150, 1.2200
Step 1: Calculate the 5-Day SMA
- SMA = (1.2000 + 1.2050 + 1.2100 + 1.2150 + 1.2200) / 5 = 1.2100
Step 2: Calculate the Standard Deviation
- Standard Deviation = √[ Σ(x – SMA)² / N ]
- Standard Deviation = 0.0079 (rounded)
Step 3: Calculate the Bands
- Upper Band = SMA + (2 × Standard Deviation) = 1.2100 + (2 × 0.0079) = 1.2258
- Lower Band = SMA – (2 × Standard Deviation) = 1.2100 – (2 × 0.0079) = 1.1942
By using these bands, traders can identify potential trading opportunities within a structured framework.
Common Mistakes in Bollinger Bands Trading and How to Avoid Them
Even with the best tools, traders can make errors when interpreting Bollinger Bands. Here are some common mistakes and how to avoid them:
1. Overtrading During Narrow Bands
- Narrow bands can tempt traders to predict breakouts prematurely.
- Solution: Wait for confirmation of a breakout with increased volume or candlestick patterns before entering a trade.
2. Ignoring the Overall Trend:
- Traders often forget to consider the broader market trend.
- Solution: Use Bollinger Bands alongside trend indicators like moving averages to align trades with the overall market direction.
3. Using Fixed Settings:
- Markets vary, and fixed Bollinger Band settings may not suit every scenario.
- Solution: Experiment with different settings (e.g., period lengths and standard deviations) to match the asset’s volatility and timeframe.
4. Failing to Combine with Other Tools:
- Solely relying on Bollinger Bands can lead to false signals.
- Solution: Pair Bollinger Bands with indicators like RSI or MACD for more reliable trade setups.
By understanding and addressing these common errors, traders can enhance their effectiveness and profitability.
Tips for Successful Forex Bollinger Bands and Volatility Trading
- Combine with Other Indicators: For more reliable signals, pair Bollinger Bands with indicators like the Relative Strength Index (RSI) or Moving Average Convergence Divergence (MACD).
- Be Patient: Avoid acting on false signals by waiting for confirmation.
- Adjust Settings: Experiment with different periods and standard deviations to align with your trading style and the asset’s characteristics.
- Mind the Trend: Always consider the overall trend when interpreting Bollinger Band signals.
- Practice Risk Management: Use stop-loss orders and manage position sizes carefully to mitigate risks.
Real-Life Applications
Scenario 1: Trading News Events
During a major economic release, such as U.S. non-farm payroll data, EUR/USD exhibits a Bollinger Squeeze.
Following the data release, the price breaks below the lower band, signaling a bearish move. A trader enters a short position, capitalizing on the subsequent downtrend.
Scenario 2: Range-Bound Market
In a calm trading environment, GBP/USD repeatedly bounces between the upper and lower Bollinger Bands.
A trader uses the Bollinger Bounce strategy, entering and exiting trades based on these boundaries, achieving consistent profits within a narrow range.
Scenario 3: Trend Continuation
After a prolonged consolidation, USD/JPY breaks above the upper Bollinger Band following an announcement by the Bank of Japan. This signals a potential bullish trend. A trader enters a long position and rides the upward momentum for significant gains.
Conclusion
Bollinger Bands are an invaluable tool for Forex traders aiming to analyze market volatility and identify profitable opportunities.
By mastering the strategies discussed—Bollinger Bounce, Bollinger Squeeze, and Breakout Trading—you can better navigate volatile markets.
Begin by experimenting with these strategies in a demo account before applying them in live markets.
Start your journey today with StyleForex.com—your partner in the exciting world of Forex trading. Unlock expert insights, practical tips, and a suite of resources designed for traders at every level.