Photo by Chris Liverani on Unsplash
How to Ride Forex Trends: Average Directional Index
In forex trading, identifying and capitalizing on trends is crucial for success. The Average Directional Index (ADX) is a powerful tool. This tool helps gauge the strength of a trend before making trading decisions.
This article explores deep into the ADX indicator, explaining how it works and how you can use it to enhance your forex trading strategies.
Real-life examples are included to ensure clarity and application.
What is the Average Directional Index (ADX)?
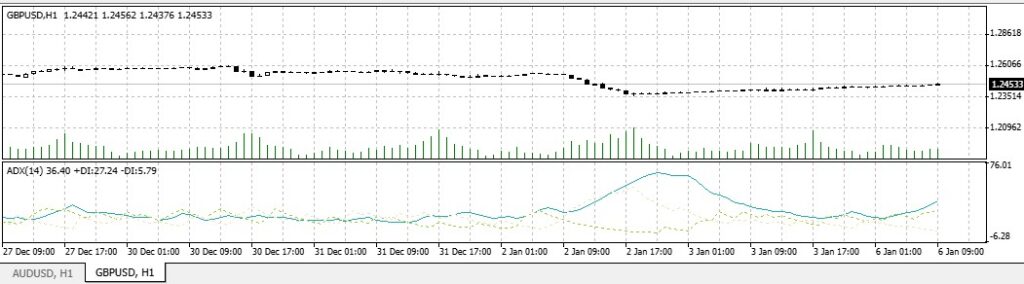
Source : WebTraders VT Markets – ADX (GBP/USD pair)
The Average Directional Index, or ADX, is a technical indicator developed by J. Welles Wilder Jr.
It measures the strength of a trend, regardless of its direction. This tool enables traders to identify whether a market is trending or range-bound, allowing them to select appropriate trading strategies.
Additionally, like other indicators such as the Bollinger Bands Indicator, which analyzes market volatility, ADX provides valuable insights for trend traders.
How ADX Works
1. Calculating ADX
Calculate the Directional Movement (DM)
- Determine the True Range (TR)
- Calculate the Directional Indicator (DI)
- Smooth the values using Wilder’s smoothing technique
- Calculate the Directional Index (DX)
- Smooth the DX to get the ADX
Here’s a simplified example:
Data for a Currency Pair:
- High: 1.2000
- Low: 1.1950
- Close: 1.1975
- Previous High: 1.1980
- Previous Low: 1.1940
- Previous Close: 1.1960
Step 1: Calculate +DM and -DM:
- +DM = Current High – Previous High = 1.2000 – 1.1980 = 0.0020
- -DM = Previous Low – Current Low = 1.1940 – 1.1950 = -0.0010
Step 2: Calculate True Range (TR): TR = Max(Current High – Current Low, |Current High – Previous Close|, |Current Low – Previous Close|) TR = Max(0.0050, 0.0040, 0.0015) = 0.0050
Step 3: Calculate +DI and -DI:
- +DI = (+DM / TR) x 100 = (0.0020 / 0.0050) x 100 = 40
- -DI = (-DM / TR) x 100 = (0.0010 / 0.0050) x 100 = 20
Step 4: Calculate DX: DX = (|+DI – -DI| / |+DI + -DI|) x 100 = (|40 – 20| / |40 + 20|) x 100 = 33.33
Step 5: Smooth DX over 14 periods to get ADX.
2. Interpreting Average Directional Index Values
ADX values range from 0 to 100. Here’s how to interpret them:
- 0-25: Weak trend or range-bound market
- 25-50: Strong trend
- 50-75: Very strong trend
- 75-100: Extremely strong trend
Similarly, tools like Bollinger Bands Values offer traders complementary information about market volatility.
Using ADX in Forex Trading
1. Identifying Strong Trends
One of the primary uses of ADX is to identify strong trends. When ADX is above 25, it indicates a trending market. The higher the ADX value, the stronger the trend.
This information is vital for forex traders, as trending markets often provide the best opportunities for profitable trades.
Example:
Imagine a trader notices the EUR/USD pair’s ADX value rises to 30. This suggests a strong trend, signaling the trader to implement a trend-following strategy.
This could be enhanced by using a 3 Bollinger Bands Strategy to confirm volatility levels.
2. Avoiding Range-Bound Markets
When ADX is below 25, it suggests a weak trend or range-bound market. In such conditions, trend-following strategies may not be as effective.
Example:
Suppose the GBP/USD pair’s ADX value remains under 20. This indicates a sideways market,
Thus, it prompts the trader to avoid entering trend-based trades and consider range-trading strategies instead.
Average Directional Index Strategies for Forex Traders
1. Trend Confirmation
ADX can confirm trends identified by other indicators. For example:
- If moving averages indicate an uptrend, check the ADX value.
- If ADX is above 25 and rising, it confirms the trend’s strength, giving you confidence to execute the trade.
Real-Life Example:
A trader identifies a potential uptrend in the USD/JPY pair using moving averages. With ADX at 28 and climbing, the trader enters a long position, confident in the trend’s strength.
This could be paired with the Bollinger Bands Squeeze, which helps identify breakout opportunities.
2. Breakout Trading
ADX is particularly useful for breakout traders. When ADX rises above 25 after a period of low values, it signals the start of a new trend.
This could be an excellent opportunity to enter a trade in the direction of the breakout.
Example:
A trader monitoring the AUD/USD pair notices a consolidation phase, with ADX below 20. Suddenly, ADX spikes to 30, signaling a breakout.
The trader enters a position in the breakout’s direction, using optimized Bollinger Bands Settings to refine their entry point.
Combining ADX with Other Indicators
To maximize the effectiveness of ADX, combine it with complementary technical indicators. For instance:
- Moving Averages: Use moving averages to confirm the trend direction while ADX indicates its strength.
- RSI (Relative Strength Index): RSI helps identify overbought or oversold conditions, adding another layer of insight to ADX analysis.
Example:
A trader sees the ADX value at 35 for the EUR/GBP pair, indicating a strong trend. By cross-referencing with the RSI, they confirm that the pair is not overbought and proceed with confidence.
ADX with Candlestick Patterns
Candlestick patterns can enhance ADX analysis by providing entry and exit signals. For example:
- Bullish Engulfing Pattern: If ADX is rising above 25 and a bullish engulfing pattern forms, it may indicate a strong uptrend.
- Bearish Engulfing Pattern: Similarly, a bearish engulfing pattern with a high ADX value suggests a strong downtrend.
Using ADX in Risk Management
Effective forex trading relies heavily on robust risk management strategies. ADX can play a crucial role in determining risk levels:
- Adjusting Position Sizes: If ADX indicates a strong trend (above 50), traders might consider increasing position sizes within their risk tolerance as strong trends often yield higher profits.
- Setting Stop-Loss Levels: Use ADX to fine-tune stop-loss orders. For instance, in a weak trend (ADX below 25), place tighter stops to mitigate potential losses.
- Time Management: ADX values can guide traders on when to exit trades. For example, if ADX starts declining in a previously strong trend, it might be time to close positions or tighten trailing stops.
By integrating ADX into risk management practices, traders can safeguard their capital while maximizing potential gains.
Limitations of Average Directional Index
While ADX is a powerful tool, it has limitations:
- Lagging Indicator: ADX is based on historical data, which may not always predict future trend strength accurately.
- No Direction Information: ADX measures trend strength, not direction. Use other indicators to determine whether the trend is bullish or bearish.
- False Signals: In volatile markets, ADX can sometimes give false signals.
To mitigate these limitations, always use ADX in conjunction with other indicators and tools.
Practical Tips for Using ADX
- Experiment on a Demo Account: Before applying ADX in live trading, practice on a demo account to understand its nuances.
- Adjust Timeframes: Experiment with different timeframes to see how ADX behaves in short-term versus long-term trends.
- Set Alerts: Use trading platforms to set alerts for specific ADX values, ensuring you don’t miss potential opportunities.
Conclusion
The Average Directional Index (ADX) is a valuable tool for forex traders seeking to spot strong trends. By learning to calculate and interpret ADX values, traders can make more informed decisions.
However, like all technical indicators, ADX works best when combined with other tools and a robust risk management strategy.
Start your journey today with StyleForex.com—your partner in the exciting world of Forex trading. Unlock expert insights, practical tips, and a suite of resources designed for traders at every level.