How to Perform a Forex Technical Analysis for Beginners
Ever wondered how Forex traders predict market trends with precision and confidence? It’s by performing a simple Forex technical analysis.
By leveraging basic tools such as candlestick charts, line charts, and technical analysis indicators like moving averages or RSI (Relative Strength Index), traders can make informed decisions.
In this guide, we delve into the steps necessary to conduct a straightforward technical analysis. We’ll share with you the skills to identify patterns, use key indicators, and enhance your trading strategies.
What is Simple Forex Technical Analysis?
Simple technical analysis is a method traders use to evaluate potential market movements by analyzing historical price data and technical analysis chart patterns.
It gives a clear view of market behavior, helping traders quickly spot trends and key levels for real-time decisions — without needing advanced math or software.
Instead, traders focus on interpreting price charts to:
- Identify trends
- Pinpoint potential entry or exit points
This straightforward approach is accessible for beginners and forms the foundation for more advanced trading strategies.
Key Components of Simple Technical Analysis
To perform a simple technical analysis, it’s crucial to grasp three fundamental concepts: support and resistance levels, trendlines, and moving averages.
1. Support and Resistance Levels
Support and resistance levels are key elements in technical analysis, representing price points where a currency pair tends to reverse direction. Learn more about support and resistance basics:
- Support: A price level where buying pressure is strong enough to prevent the price from falling further. Think of it as a floor that cushions falling prices.
- Resistance: A price level where selling pressure is strong enough to prevent the price from rising further. Consider it a ceiling that limits upward movement.
How to Identify Support and Resistance Levels:
- Look for areas where the price has bounced multiple times.
- Draw horizontal lines at these points.
Real-Life Example:
If the EUR/USD pair repeatedly bounces off 1.1000 and struggles to break below it, 1.1000 is a support level.
Conversely, if the price fails to rise above 1.1500, this becomes a resistance level.
2. Trendlines in Forex Technical Analysis
Trendlines are powerful tools for visualizing the overall direction of the market. Learn more about trendlines: They help traders identify whether the market is trending upwards, downwards, or moving sideways.
How to Draw Trendlines:
- For an uptrend: Connect at least two low points on the chart.
- For a downtrend: Connect at least two high points on the chart.
Real-Life Example:
If the GBP/USD pair shows higher lows over time, draw an upward trendline connecting these lows. This indicates an uptrend and provides clues about potential support levels.
3. Moving Averages
(10-Day Simple Moving Average Chart)
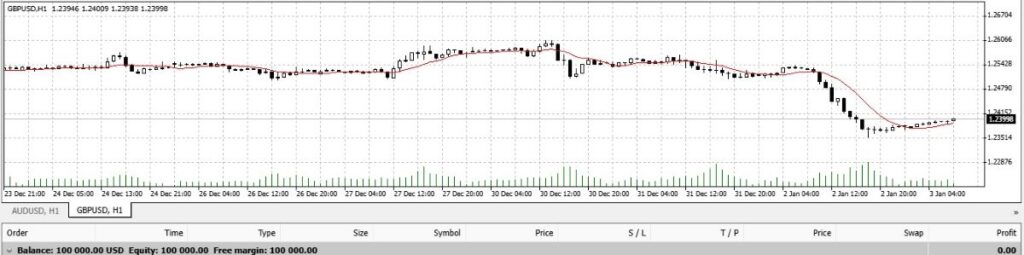
Source: WebTraders VT Markets Demo Account
Moving averages smooth out price data. Thus, this technical indicator creates a flowing line that simplifies trend identification and highlights support/resistance levels.
Simple Moving Average (SMA) Calculation:
SMA = (Sum of closing prices over n periods) / n
Real-Life Example:
To calculate a 10-day SMA, sum the closing prices of the last 10 days and divide by 10.
For example,:
If the closing prices for the last 10 days are: 1.2000, 1.2100, 1.2200, 1.2300, 1.2400, 1.2500, 1.2600, 1.2700, 1.2800, and 1.2900, then the SMA = (1.2000 + 1.2100 + 1.2200 + 1.2300 + 1.2400 + 1.2500 + 1.2600 + 1.2700 + 1.2800 + 1.2900) / 10 = 1.2450.
This creates a smoothed line reflecting average price movement over the period.
Steps to Perform a Simple Forex Technical Analysis
With a clear understanding of the key components, let’s use this technical analysis guide to walk through the steps of conducting a simple analysis:
- Choose Your Timeframe: Start with a daily chart to gain a broad market perspective.
- Identify Support and Resistance Levels: Look for areas where the price has repeatedly reversed or bounced.
- Draw Trendlines: Connect highs for downtrends and lows for uptrends.
- Add Moving Averages: Use the 50-day and 200-day SMAs to identify long-term trends.
- Analyze Price Action: Look for technical analysis patterns such as double tops, double bottoms, or head and shoulders.
- Consider Volume: Higher volume often confirms the strength of a trend.
- Identify Confluences: Areas where multiple indicators align signal stronger trading opportunities.
Practical Example: EUR/USD Chart Analysis
Let’s apply these steps to a hypothetical EUR/USD chart:
Step 1: Identify Support and Resistance
- The price repeatedly bounces off 1.1200, establishing this as a support level.
- The price struggles to rise above 1.1400, making this a resistance level.
Step 2: Draw Trendlines for Forex Technical Analysis
- Connecting recent lows, we draw an upward trendline from 1.1100 to 1.1300, signaling an uptrend.
Step 3: Use Moving Averages
- The 50-day SMA is above the 200-day SMA, indicating a bullish trend. This happens because the 50-day SMA, reflecting shorter-term trends, is stronger than the 200-day SMA. So, this confirms an upward momentum.
Step 4: Analyze
- The EUR/USD’s upward trend, confirmed by the trendline and moving averages, signals a buy opportunity near support with a stop loss just below. For example, if the support is at 1.1200, a trader might place a stop loss at 1.1180 to limit potential losses.
Benefits of Simple Forex Technical Analysis
Simple technical analysis is ideal for beginners, offering an easy way to start trading and build essential skills for long-term success.
Beginners can also explore this risk management guide for added support: Here’s a list of the benefits of conducting technical analysis:
- Ease of Use: It’s simple and requires no advanced software, perfect for beginners. New traders can easily understand and apply it in real markets.
- Visual Clarity: Charts simplify data, helping traders quickly identify trends and price movements.
- Actionable Insights: Recognizing trends and levels allows for informed and confident decisions, improving long-term results.
- Foundation for Growth: Mastering these basics prepares traders to explore advanced strategies.
- Flexibility Across Markets: Originally for Forex, it’s also effective in stocks, commodities, and cryptocurrencies.
Real-Life Application: A Beginner Trader’s Journey
Consider ABC, a novice Forex trader. She starts by applying simple technical analysis to historical charts:
- She identifies support at 1.1000 and resistance at 1.1200 on an EUR/USD chart.
- Drawing a trendline, she notes the market’s gradual uptrend.
- Adding a 50-day SMA, Sarah confirms the bullish sentiment.
With this analysis, Sarah decides to buy near the support level of 1.1000, setting a stop loss below 1.0950 to minimize risk.
Her careful approach pays off as the price rises to 1.1200, where she exits the trade with a profit.
This example highlights the importance of setting clear entry and exit points to manage risk effectively and secure gains.
Conclusion
Simple technical analysis in Forex is a valuable skill for beginner traders. By mastering support and resistance levels, trendlines, and moving averages, traders can effectively identify market trends and potential trading opportunities.
Practical application of these principles builds confidence and lays a solid foundation for exploring advanced techniques in the future.
Start your journey today with StyleForex.com—your partner in the exciting world of Forex trading. Unlock expert insights, practical tips, and a suite of resources designed for traders at every level.