
Photo by Jonathan Francisca on Unsplash
How Forex Oscillators Work : RSI, Stochastic, and MACD
Forex oscillators are tools to improve how you trade by giving clues about where the market might be headed. These tools answer key questions, like “What is oscillator in Forex?” They help traders see when the market might reverse, when prices are too high or low, and when hidden patterns might be forming.
In this guide, we’ll explore three popular Forex oscillators: RSI, Stochastic, and MACD. Learning how to use these can help you make smarter trading choices.
What Is an Oscillator in Forex?
Forex oscillators are indicators that move between set limits, usually on a scale of 0 to 100. They help traders spot momentum and possible market turning points.
Wondering how to use oscillators in trading? These tools are great for identifying trends and timing your trades better.
Some of the most popular oscillators Forex traders use include:
- Relative Strength Index (RSI)
- Stochastic Oscillator
- Moving Average Convergence Divergence (MACD)
These tools are particularly useful for traders who want to sharpen their analysis and decision-making skills.
Relative Strength Index (RSI) as a Forex Oscillator
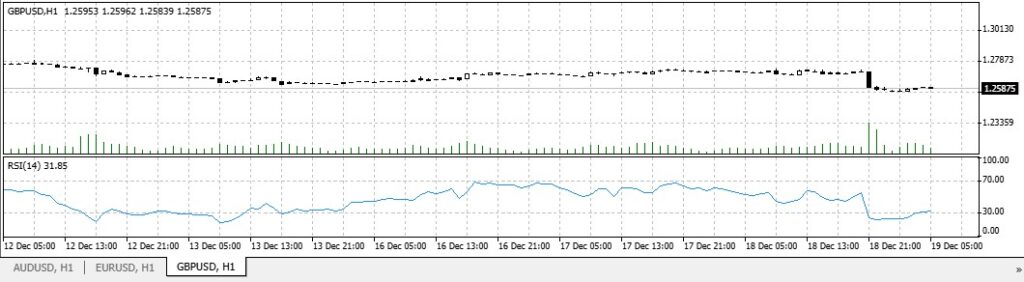
The RSI measures how fast and how much prices are changing. It’s easy to use and very effective. Therefore, this is why many traders rely on it.
How RSI Works
RSI looks at average gains and losses over a set period, usually 14 days. For example, if the EUR/USD currency pair gained 100 pips over 7 days but lost 50 pips over the next 7 days, you first calculate the average gain (100/7 = 14.29) and the average loss (50/7 = 7.14).
Next, divide the average gain by the average loss to get the Relative Strength (RS = 14.29 / 7.14 = 2).
Finally, plug the RS into the RSI formula: RSI = 100 – [100 / (1 + RS)], which becomes RSI = 100 – [100 / (1 + 2)] = 100 – 33.33 = 66.67.
This value helps Forex traders assess if the market is overbought or oversold.
Forex Oscillators: Interpreting RSI Signals
RSI values tell you whether the market might be overbought or oversold:
- Above 70: Overbought (prices might drop soon).
- Below 30: Oversold (prices might rise soon).
You can adjust these levels based on what works best for you.
RSI Trading Strategies
- Overbought/Oversold Reversal: Sell when RSI drops below 70; buy when it rises above 30.
- Divergence: Watch for differences between RSI and price trends to spot possible reversals.
- Support/Resistance: Use RSI to confirm breakouts or breakdowns in price.
Forex Oscillators: Stochastics
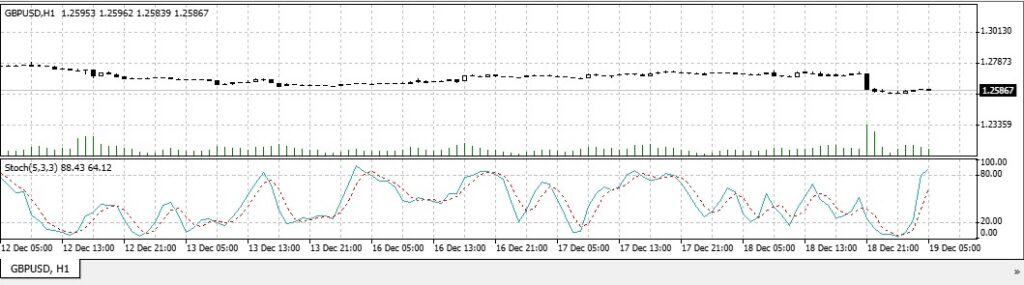
The Stochastic Oscillator compares a closing price to its highest and lowest prices over a set period, typically 14 days.
For example, if the EUR/USD pair closes at 1.2000, with a range between 1.1800 (low) and 1.2100 (high), the oscillator finds its value using this formula: ((Closing Price – Lowest Price) / (Highest Price – Lowest Price)) × 100.
In this case, ((1.2000 – 1.1800) / (1.2100 – 1.1800)) × 100 = 66.67. This places the closing price at 66.67% of the range, helping traders assess market momentum.
This makes it great for spotting possible market reversals.
Fast and Slow Stochastic
There are two types:
- Fast Stochastic: Reacts quickly to price changes, providing timely signals but often prone to errors.
- Slow Stochastic: Filters out noise, delivering smoother and more reliable signals.
Reading Stochastic Signals
The Stochastic Oscillator gives values from 0 to 100:
- Above 80: Overbought (prices may drop).
- Below 20: Oversold (prices may rise).
It includes two lines:
- %K: The faster line, which measures the current closing price relative to the price range over a given period. F For example, if the closing price is 1.2000, the lowest price is 1.1800, and the highest price is 1.2100 over the period, %K = ((1.2000 – 1.1800) / (1.2100 – 1.1800)) × 100 = 66.67.
- %D: The slower line, which is a moving average of %K, helping to smooth out fluctuations for better trend signals. For example, if %K values over three periods are 66, 70, and 74, then %D is calculated as their average: (66 + 70 + 74) / 3 = 70.
Forex Oscillators: Stochastic Trading Techniques
- Crossover Strategy: Buy when %K crosses above %D; sell when %K crosses below %D.
- Overbought/Oversold Reversal: Look for reversals when values hit extreme levels.
- Divergence: Spot hidden strengths or weaknesses in a trend by comparing price action to Stochastic movement.
Moving Average Convergence Divergence (MACD)
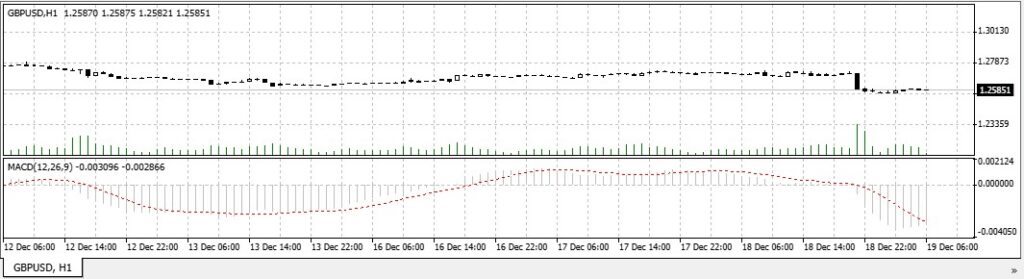
MACD is a momentum indicator that tracks the relationship between two moving averages of a price.
MACD Components
- MACD Line: The gap between the 12-day and 26-day moving averages.
- Signal Line: A 9-day moving average of the MACD line.
- MACD Histogram: The difference between the MACD and signal lines.
Forex Oscillators: MACD Signal Interpretation
- Bullish Signal: MACD crosses above the signal line.
- Bearish Signal: MACD crosses below the signal line.
- Overbought/Oversold: Extreme histogram values may signal potential trend reversals. For example: if the MACD histogram shows unusually high positive values, it could mean the market is overbought and a downward reversal is likely. Conversely, very low negative values might indicate oversold conditions and a potential upward reversal. signal reversals.
MACD Trading Strategies
- Signal Line Crossover: Buy when MACD crosses above the signal line; sell when it crosses below.
- Zero Line Crossover: Confirm trends when MACD crosses above or below the zero line.
- Divergence: Watch for differences between price and MACD to spot potential reversals.
Combining Forex Oscillators for Better Results
Using multiple oscillators together can give you stronger signals and reduce mistakes. Here are some tips:
- Confirm Signals: Use RSI to back up Stochastic signals or vice versa.
- Trend Identification: Combine MACD with RSI or Stochastic to see both momentum and trend direction.
- Divergence Analysis: Look for differences across oscillators for stronger reversal clues.
- Time Frame Analysis: Check oscillators across different time frames to get a clearer market picture.
Conclusion
Getting good at using Forex oscillators like RSI, Stochastic, and MACD can really improve your trading.
Practice using these oscillators in different market situations to see what works best for you. They can help you spot overbought or oversold conditions, potential trend reversals, and hidden market patterns.
Stay focused, manage your risk, and keep learning as market conditions change.
Start your journey today with StyleForex.com—your partner in the exciting world of Forex trading. With expert insights and helpful resources, you’ll be on your way to becoming a successful trader.