
Photo by Tech Daily on Unsplash
Forex Charts: How to Read Trends and Trade with Confidence
Forex charts are important tools for traders at every level. Learning how to read these charts can help you make better trading decisions.
In this article, we’ll cover the main types of Forex charts, like line, bar, and candlestick charts. We’ll explain how they work and when you should use each one.
What Are Forex Charts?
Forex charts show how currency pair prices move over time. For example, you can see price changes for the EUR/USD pair.
Tools like forex daily charts and forex historical charts make it easier for traders to spot trends and plan their trades.
These charts are key for analyzing the market. They also help you find the best times to enter or exit a trade.
Types of Forex Charts
There are three main types of Forex charts you’ll use: line charts, bar charts, and candlestick charts. Let’s take a closer look at each one.
1. Line Charts
Line charts are the simplest type of Forex chart. They connect closing prices with a continuous line over a certain period. Here’s how they work:
- The vertical axis shows the price.
- The horizontal axis shows time.
- Each point on the line represents the closing price at that time.
Line charts are great for seeing overall price trends. They’re also easy to use with forex charting software, making them ideal for beginners.
However, they only show closing prices, so they leave out details like how prices moved during the time period.
2. Bar Charts
Bar charts provide more details than line charts. Each bar represents a specific time period and includes four key price points:
- Open: The starting price for the time period, shown by a small line on the left.
- High: The highest price during the time period, marked at the top of the bar.
- Low: The lowest price during the time period, marked at the bottom of the bar.
- Close: The ending price for the time period, shown by a small line on the right.
These charts are also called OHLC charts (Open, High, Low, Close). They give a fuller picture of price movements, making it easier to identify trends using forex price charts.
3. Candlestick Charts
Source: Investopedia
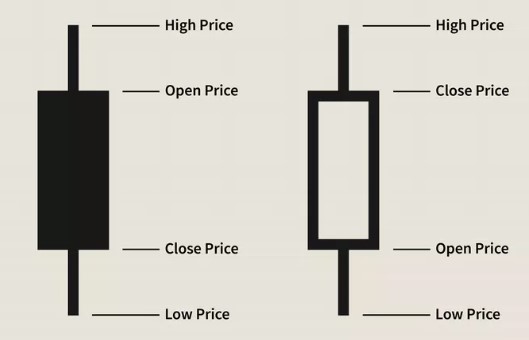
Candlestick charts are the most popular type of Forex chart. They show the same information as bar charts but in a more visual way. Each “candlestick” has:
- A body: This shows the open and close prices.
- Wicks (or shadows): These show the high and low prices.
The color of the candlestick shows whether the price went up or down:
- Green or white: The price closed higher than it opened.
- Red or black: The price closed lower than it opened.
Candlestick charts are favored because they make it easy to see price action and market sentiment.
With forex charts technical analysis, you can spot patterns and predict market trends. Specific candlestick patterns, like doji or engulfing patterns, can signal bullish or bearish behavior.
How to Read Forex Charts
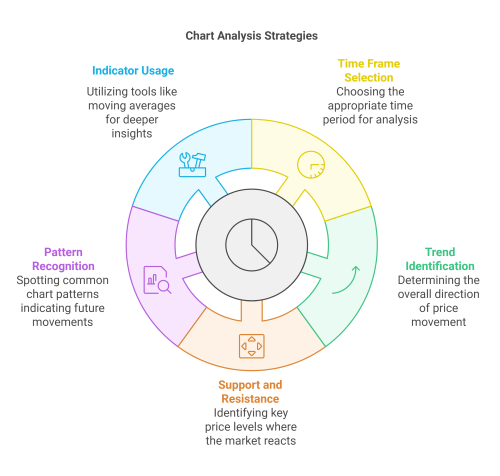
To understand Forex charts, including those viewed with forex chart viewer tools, follow these steps:
- Pick a time frame: Charts can show data for different time periods, like minutes, hours, or months. Choose one that fits your trading style.
- Check the trend: Look for the overall direction of the price. Is it going up, down, or staying flat?
- Find support and resistance levels: Support is a price level where the market tends to rise, while resistance is where it tends to fall.
- Look for patterns: Common chart patterns, like head and shoulders or double tops, can hint at future price movements.
- Use indicators: Combine chart analysis with tools like moving averages or the Relative Strength Index (RSI) to gain extra insights.
Practical Example
Let’s go through a quick example of reading a Forex chart:
You’re looking at a daily candlestick chart for the EUR/USD pair. Here’s what you see:
- The trend has been going up for the past month.
- There’s a strong support level at 1.1800.
- The price has just bounced off this support level and formed a large green candlestick.
Based on this, you might think:
- The uptrend will continue.
- The 1.1800 support level is strong, making it a good place to enter a trade.
- The green candlestick shows strong buying pressure.
You can also calculate the price movement:
- Open price: 1.1805
- Close price: 1.1850
- Price move: 1.1850 – 1.1805 = 0.0045 or 45 pips
This 45-pip move suggests strong upward momentum.
Conclusion
Learning to read Forex charts is essential for successful trading. Charts help you understand market trends and find trading opportunities.
Whether you prefer line, bar, or candlestick charts, each type has unique advantages.
Reading charts takes practice, but with time, you’ll get better. Start with one type of chart and add more as you gain experience. Keep learning and practicing to improve your skills.
Ready to begin? Start your journey today with StyleForex.com to access expert insights, helpful tips, and trading resources designed for all levels of traders.